Key Insights:
- Ethereum price analysis shows a bearish market
- ETH has plunged below the $1,900 level
- ETH support is seen at the $1,866 mark
The latest Ethereum price analysis shows that the cryptocurrency has been in a bearish trend since the bears took control of the market. ETH prices have broken below $1,900, and bearish activity appears to be taking hold in the broad cryptocurrency market. At press time, ETH is trading at $1,879 and appears to be heading further south as the bearish activity takes hold.

Following the drop, ETH is at risk of falling below the $1,866 level, which would be a complete break from the recent uptrend. If this support level is broken, ETH could fall to the next major support level, around $1,800. Resistance has been created at the $1,900 level, which could be a strong barrier to any upside momentum in the near term.
The market cap of Ethereum is currently at $225 billion and is the second-largest cryptocurrency behind Bitcoin. The market cap of Ethereum has decreased by 0.53% in the past 24 hours. The 24-hour trading volume of Ethereum has dropped to $6.69 billion, which is 45.95% lower than a day ago.

The broad cryptocurrency market has been affected by bearish activity recently, with BTC prices also retracing toward the $30k mark again. ETH was not an exemption from this trend, and the price has dropped significantly. If ETH fails to hold above the $1,866 support level, it could be in for further losses as the bearish activity takes over the market. Most Altcoins are trading in red, suggesting a further bearish market.
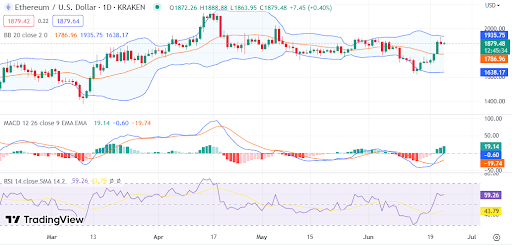
Looking at the technical analysis of Ethereum, most of the indicators are still positive. The MACD line is above the signal line, with the green bars ruling the chart, which could signify a short-term bearish trend. The RSI is hovering at 59 levels but has changed its direction and is trending downwards. Furthermore, the Bollinger band has remained with its wide structure, with the price trading alongside the upper band.
Overall, Ethereum is in a bearish trend, just below the $1,900 level. If the bears continue dominating the market, ETH could fall toward the $1,866 support level and then further toward $1,800. However, ETH could see some upside movement if buyers regain market control.
Mubashir Ahmed is a multifaceted market analyst with extensive knowledge of the blockchain industry. He is proficient in market analysis and blockchain technology, having had experience with numerous projects in the space. He has a deep understanding of the Cryptocurrency industry, its trends, and how to best approach investing in it.